From Benchmarking to Guidance: A New Paradigm for Setting Priorities and Delivering Results
Key Takeaways:
- Traditionally, benchmarking has served as the primary way for organizations to diagnose and prioritize initiatives.
- The Organization Guidance System (OGS) utilizes technology and data to move beyond benchmarking into a more predictive way to handle initiatives.
- OGS has all of the benefits of benchmarking and it also provides guidance about what we should do.

From Benchmarking to Guidance: A New Paradigm for Setting Priorities and Delivering Results

Truly innovative ideas disrupt our thinking and how we do business. The Organization Guidance System (OGS), a new technology platform, co-sponsored by The RBL Group and CorpU is such a disruption. It goes beyond benchmarking the best practices of other companies as the primary way to improve organization and people practices to technology-enabled guidance to tell us which initiatives will have the most impact on our business results.
This is both exciting and scary. It's scary because most of us have grown up with benchmarking as the primary way to diagnose and prioritize initiatives. Benchmarking is a consulting company and professional expert orthodoxy. It's hard to imagine a shift away from large databases filled with benchmarks—comparative information about what companies, industries, and geographies are doing in specific practices to another option. It's also exciting because it opens up options for impact that go well beyond benchmarking. It is an enormous shift and, if you are willing to adopt, provides a huge advantage to you as a professional in human capital. The advantage is that it enables you to focus on what drives results vs. copying what others are doing that might impact your results.
Benchmarking Best Practices: Comparing ourselves to others for Insights
Think of all of the initiatives you have underway today—improving efficiencies, increasing agility, shifting to digital, improving leadership development, and so on. When we benchmark, we choose one of these practices of interest and compare ourselves to other companies to find “best practices.” For example, we can benchmark the leaders in our organization to leaders in other companies. At RBL, we have conducted leadership audits for the last twenty years and provided benchmark data to our clients, see example:
| Leadership Capability | A How well we do it? (1 low to 10 high) |
B Global Norms (percentile) |
|---|---|---|
|
1.
Clarify business case for leadership: We have a clear business rationale for why leadership matters for business success.
|
6 | 55% |
|
2.
Define what effective leaders know and do: We have a definitive leadership competency model that defines the knowledge, skills, and behaviors of leaders that will deliver strategy (leadership profile, standards, expectations).
|
4 | 30% |
|
3.
Assess leaders: We have a rigorous assessment of the quality of individual leaders and of our overall leadership group (leadership pipeline).
|
8 | 90% |
|
4.
Invest in leaders: We appropriately invest in ways to develop leaders throughout the organization through training, development experiences, non-work experiences, coaching, and so forth (individual development plan, leadership academy, career development).
|
5 | 40% |
|
5.
Measure impact of leaders: We make sure we measure the impact of leaders' personal competencies and leadership organization investments on key outcomes that matter to monitor leadership impact (Moneyball).
|
4 | 60% |
|
6.
Ensure reputation: We make sure that leadership reputation shows up with internal (employee) and external (customer, investor, community) stakeholders (intangibles, leadership capital index).
|
8 | 90% |
The leadership audit has 6 components based on our best-selling book—Leadership Brand: 1. Business case for leadership; 2. Define what effective leaders know and do; and so on. Column A shows the average score for those filling out the survey in our organization. Column B shows how our scores compare to the global norm in each of the 6 components. Based on our benchmark data there are two options for finding insights and then taking action. Either we fix weaknesses or we build on our strengths.
| Leadership Capability | A How well we do it? (1 low to 10 high) |
B Global Norms (percentile) |
|---|---|---|
|
1.
Clarify business case for leadership: We have a clear business rationale for why leadership matters for business success.
|
6 | 55% |
|
2.
Define what effective leaders know and do: We have a definitive leadership competency model that defines the knowledge, skills, and behaviors of leaders that will deliver strategy (leadership profile, standards, expectations).
|
4 | 30% |
|
3.
Assess leaders: We have a rigorous assessment of the quality of individual leaders and of our overall leadership group (leadership pipeline).
|
8 | 90% |
|
4.
Invest in leaders: We appropriately invest in ways to develop leaders throughout the organization through training, development experiences, non-work experiences, coaching, and so forth (individual development plan, leadership academy, career development).
|
5 | 40% |
|
5.
Measure impact of leaders: We make sure we measure the impact of leaders' personal competencies and leadership organization investments on key outcomes that matter to monitor leadership impact (Moneyball).
|
4 | 60% |
|
6.
Ensure reputation: We make sure that leadership reputation shows up with internal (employee) and external (customer, investor, community) stakeholders (intangibles, leadership capital index).
|
8 | 90% |
Using benchmarks like these are the primary source for diagnosing and prioritizing improvement initiatives and is “Best Practice” today. Arguing against benchmarks seems counterproductive. If the top companies for leaders in our database do something well as part of their leadership practice and we want to have better leaders, then shouldn't we copy them and build that practice too?
Benchmarking provides descriptive data. It describes how our scores compare to the scores of other companies. It becomes prescriptive as we use the lens of fixing weaknesses or building on strengths as our source of insight for what to do. Finally, we take action about how to improve in the targeted areas.
Most, if not all consultancies have built their business and amassed comparative databases using benchmark logic. They, like us, do research, write books and articles, and create assessment tools that have benchmark data that guide recommendations. Until now. Now, there's an alternative that has emerged as technology has improved to provide a different and higher impact logic than benchmarking. We call it Organization Guidance.
Organization Guidance System (OGS): Predicting what we should do to get results
Organization Guidance System (OGS) uses a different logic than benchmarking to fix weaknesses or build on strengths. This alternative has a much higher impact because it provides a third level of information, whereas benchmarking has two:
Levels of Information:
- Descriptive data—how do we compare to other organizations?
- Prescriptive insight—what could we do based on this comparison?
- Predictive Guidance—what should we do to most impact results in our company?
Predictive guidance shifts us from benchmarking about what we could do to guidance on what we should do to achieve the outcomes we want. OGS has all of the benefits of benchmarking and it also provides guidance about what we should do. In benchmarking we start with an activity where we want to compare ourselves to others. Then we choose initiatives to either fix weaknesses or build on strengths. Internal practitioners or external consultants then look at whether or not there was an impact on results. OGS moves directly into predicting what we should do to get the desired results. It skips the need for benchmarking. It's there if interested, but not critical to prioritizing or taking action.
The OGS provides some of the best benchmarking data available, but it goes further than adapting the practice of what others are doing to ensure that assessment leads directly to what most impacts results in our organization. By adopting OGS logic, benchmarking is no longer sufficient. It doesn't go away and it's interesting, but it is no longer the primary logic.
With the OGS, we start with the results we want to achieve as opposed to starting with the activity we want to compare. OGS shifts the priority from what you could do based on how you compare to other organizations, to what you should do to best impact your organization's results. The OGS is predictive about results you will achieve if you focus on targeted practices.
In the OGS, people still fill out assessments like the leadership capability survey we showed earlier. People still get the benchmark information (Columns A &B). But the report adds guidance related to specific business outcomes (Columns C, D, E and F).
| Leadership Brand | A Global Mean (n=166) |
B ABC (n=11) |
What guidance can we offer? (relative impact on… divide 100 points) |
|||
|---|---|---|---|---|---|---|
| C Employee |
D Strategy / Business |
E Customer |
F Financial |
|||
| Clarify business case for leadership
We have a clear business rationale for why leadership matters for business success. |
3.46 | 2.96 | ||||
| Define what effective leaders know and do
We have a definitive leadership competency model that defines the knowledge, skills, and behaviors of leaders that will deliver strategy. (leadership profile, standards, expectations) |
3.57 | 3.13 | ||||
| Assess leaders
We have a rigorous assessment of the quality of individual leaders and of our overall leadership group. (leadership pipeline) |
3.22 | 2.52 | ||||
| Invest in leaders
We appropriately invest in ways to develop leaders throughout the organization through training, development experiences, non-work experiences, coaching, and so forth. (individual development plan, leadership academy, career development) |
3.26 | 2.83 | ||||
| Measure impact of leaders
We make sure we measure the impact of leaders' personal competencies and leadership organizational investments on key outcomes that matter to monitor leadership impact. (Moneyball) |
2.59 | 2.10 | ||||
| Ensure reputation
We make sure that leadership reputation shows up with internal (employee) and external (customer, investor, community) stakeholders (intangibles, leadership capital index). |
3.32 | 3.04 | ||||
| Model R2 | 27 | 25.8 | 29.5 | 21.2 | ||
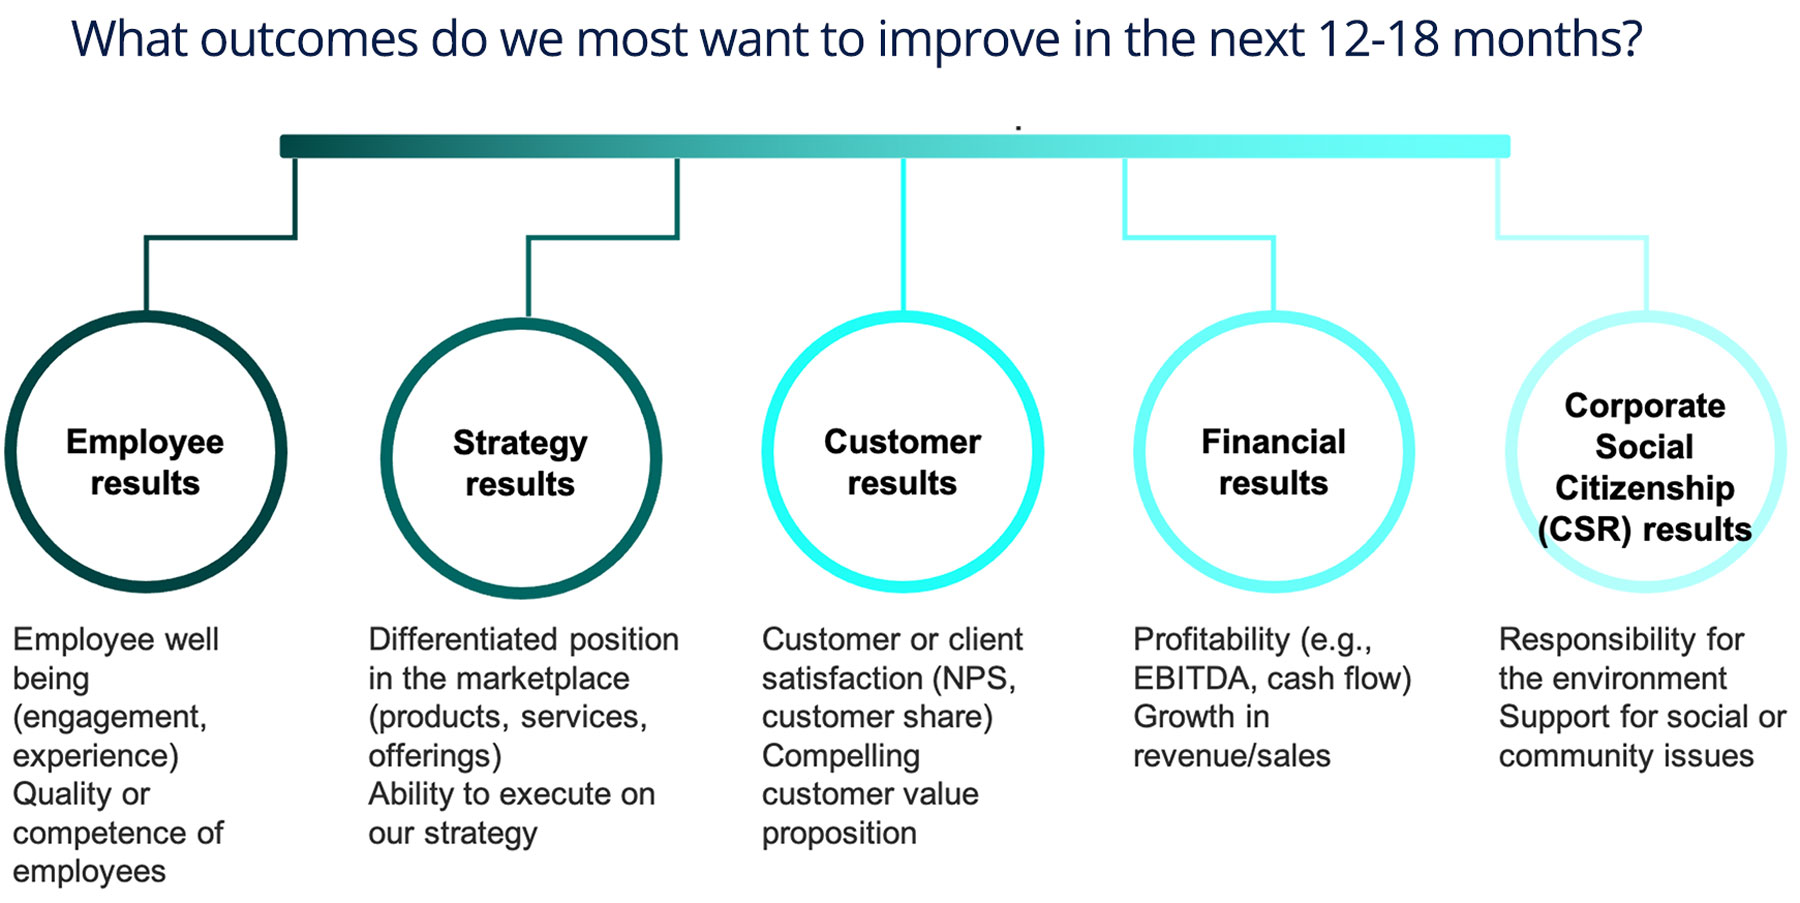
In the earlier benchmarking report, ABC company received a report with columns A and B only. Column A shows the global mean and column B, our company mean. With these columns, the only choice is to use benchmarking logic and either fix weaknesses or build on strengths. But using the OGS, we also have columns C, D, E, and F (employee, strategy, customer, and finance). Each of these columns is defined in the earlier figure—What outcomes do we most want to improve in the next 12–18 months?
Using columns C, D, E, and F, we can now use guidance logic. In guidance logic, algorithms prioritize areas where we score relatively low and where there is a high impact on this result area—these areas are shaded green. Areas shaded red mean that there is relatively little impact in this area for this business result—either because we already do it well enough or because it's low impact on results.
In this example from a healthcare company, we can see that component #1 “clarifying the business case,” impacts every result area: C, D, E, and F are all green. Contrast these scores to component #4 “invest in leaders,” where columns C, D, E, and F are red. The implication of this was a real surprise to ABC company leaders since they had planned to spend a significant amount of money on leadership development programs in 2021. Based on guidance logic, this money would have been wasted and they should focus on their business case if they were interested in investing in leadership priorities that impacted overall results.
There are other messages in this OGS report. The business case jumps out because it's green across all result areas. But if the intention is more specific such as how do leaders improve employee results such as employee engagement, then guidance suggests finding the green boxes in column C and it's apparent that the way to most impact employees is to clarify the business case, define a leadership competency model and assess leaders. Conversely if the intent is to have more customer impact, it would be critical to also ensure our leadership reputation by finding ways to communicate more frequently about what our leaders are focused on (business case) and on our business case progress. The OGS is agnostic about which solution provider or approach you use to improve any targeted initiative. Rather, it clarifies where you should invest for results. It's analogous to a balanced financial portfolio—it provides structure (what are my options) as well as guidance about where and how to invest your money.
Summary: Benchmarking and Guidance
| Definition and Approach | Impact | |
|---|---|---|
| Benchmarking |
|
|
| Organization Guidance System |
|
Has descriptive data and prescriptive insights but primary impact through:
|
Learn more about the Organization Guidance System's transformational approach to target and measure the impact of organization investments. Contact us for free access to try one or more assessments in leadership, talent, organization, and HR. It's more fun and impactful to get multiple others from your organization to try it out.